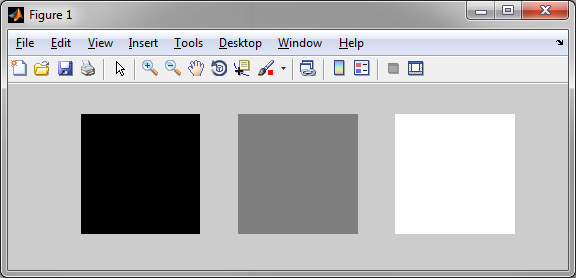
Let’s say that you have a set of images that you want to tile using imshow() and subplot() in a MATLAB figure. By default, both functions add a padded space around the images to separate them, as this example shows:
I1 = zeros(500,'uint8');
I2 = zeros(500,'uint8')+127;
I3 = zeros(500,'uint8')+255;

figure
subplot(1,3,1), imshow(I1);
subplot(1,3,2), imshow(I2);
subplot(1,3,3), imshow(I3);
Result:

However, what if you want to tile the images without any space between them? The imshow() function does have a property to remove the border around a displayed image, by using imshow(I, 'border', 'tight'). This is fine when only one image is being displayed, but subplot() itself adds additional spacing between images. Removing this space is not straightforward, but a gap-less subplot grid can be constructed by using the following function in place of subplot():
function h = subplottight(n,m,i)
    [c,r] = ind2sub([m n], i);
    ax = subplot('Position', [(c-1)/m, 1-(r)/n, 1/m, 1/n])
    if(nargout > 0)
      h = ax;
    end
By using this function, a completely borderless subplot of images can be constructed as follows:
I1 = zeros(500,'uint8');
I2 = zeros(500,'uint8')+127;
I3 = zeros(500,'uint8')+255;

figure
subplottight(1,3,1), imshow(I1, 'border', 'tight');
subplottight(1,3,2), imshow(I2, 'border', 'tight');
subplottight(1,3,3), imshow(I3, 'border', 'tight');
Result:
